Finance
Every Company In and Out of the Dow Jones Industrial Average Since 1928
View the full-size version of this infographic.
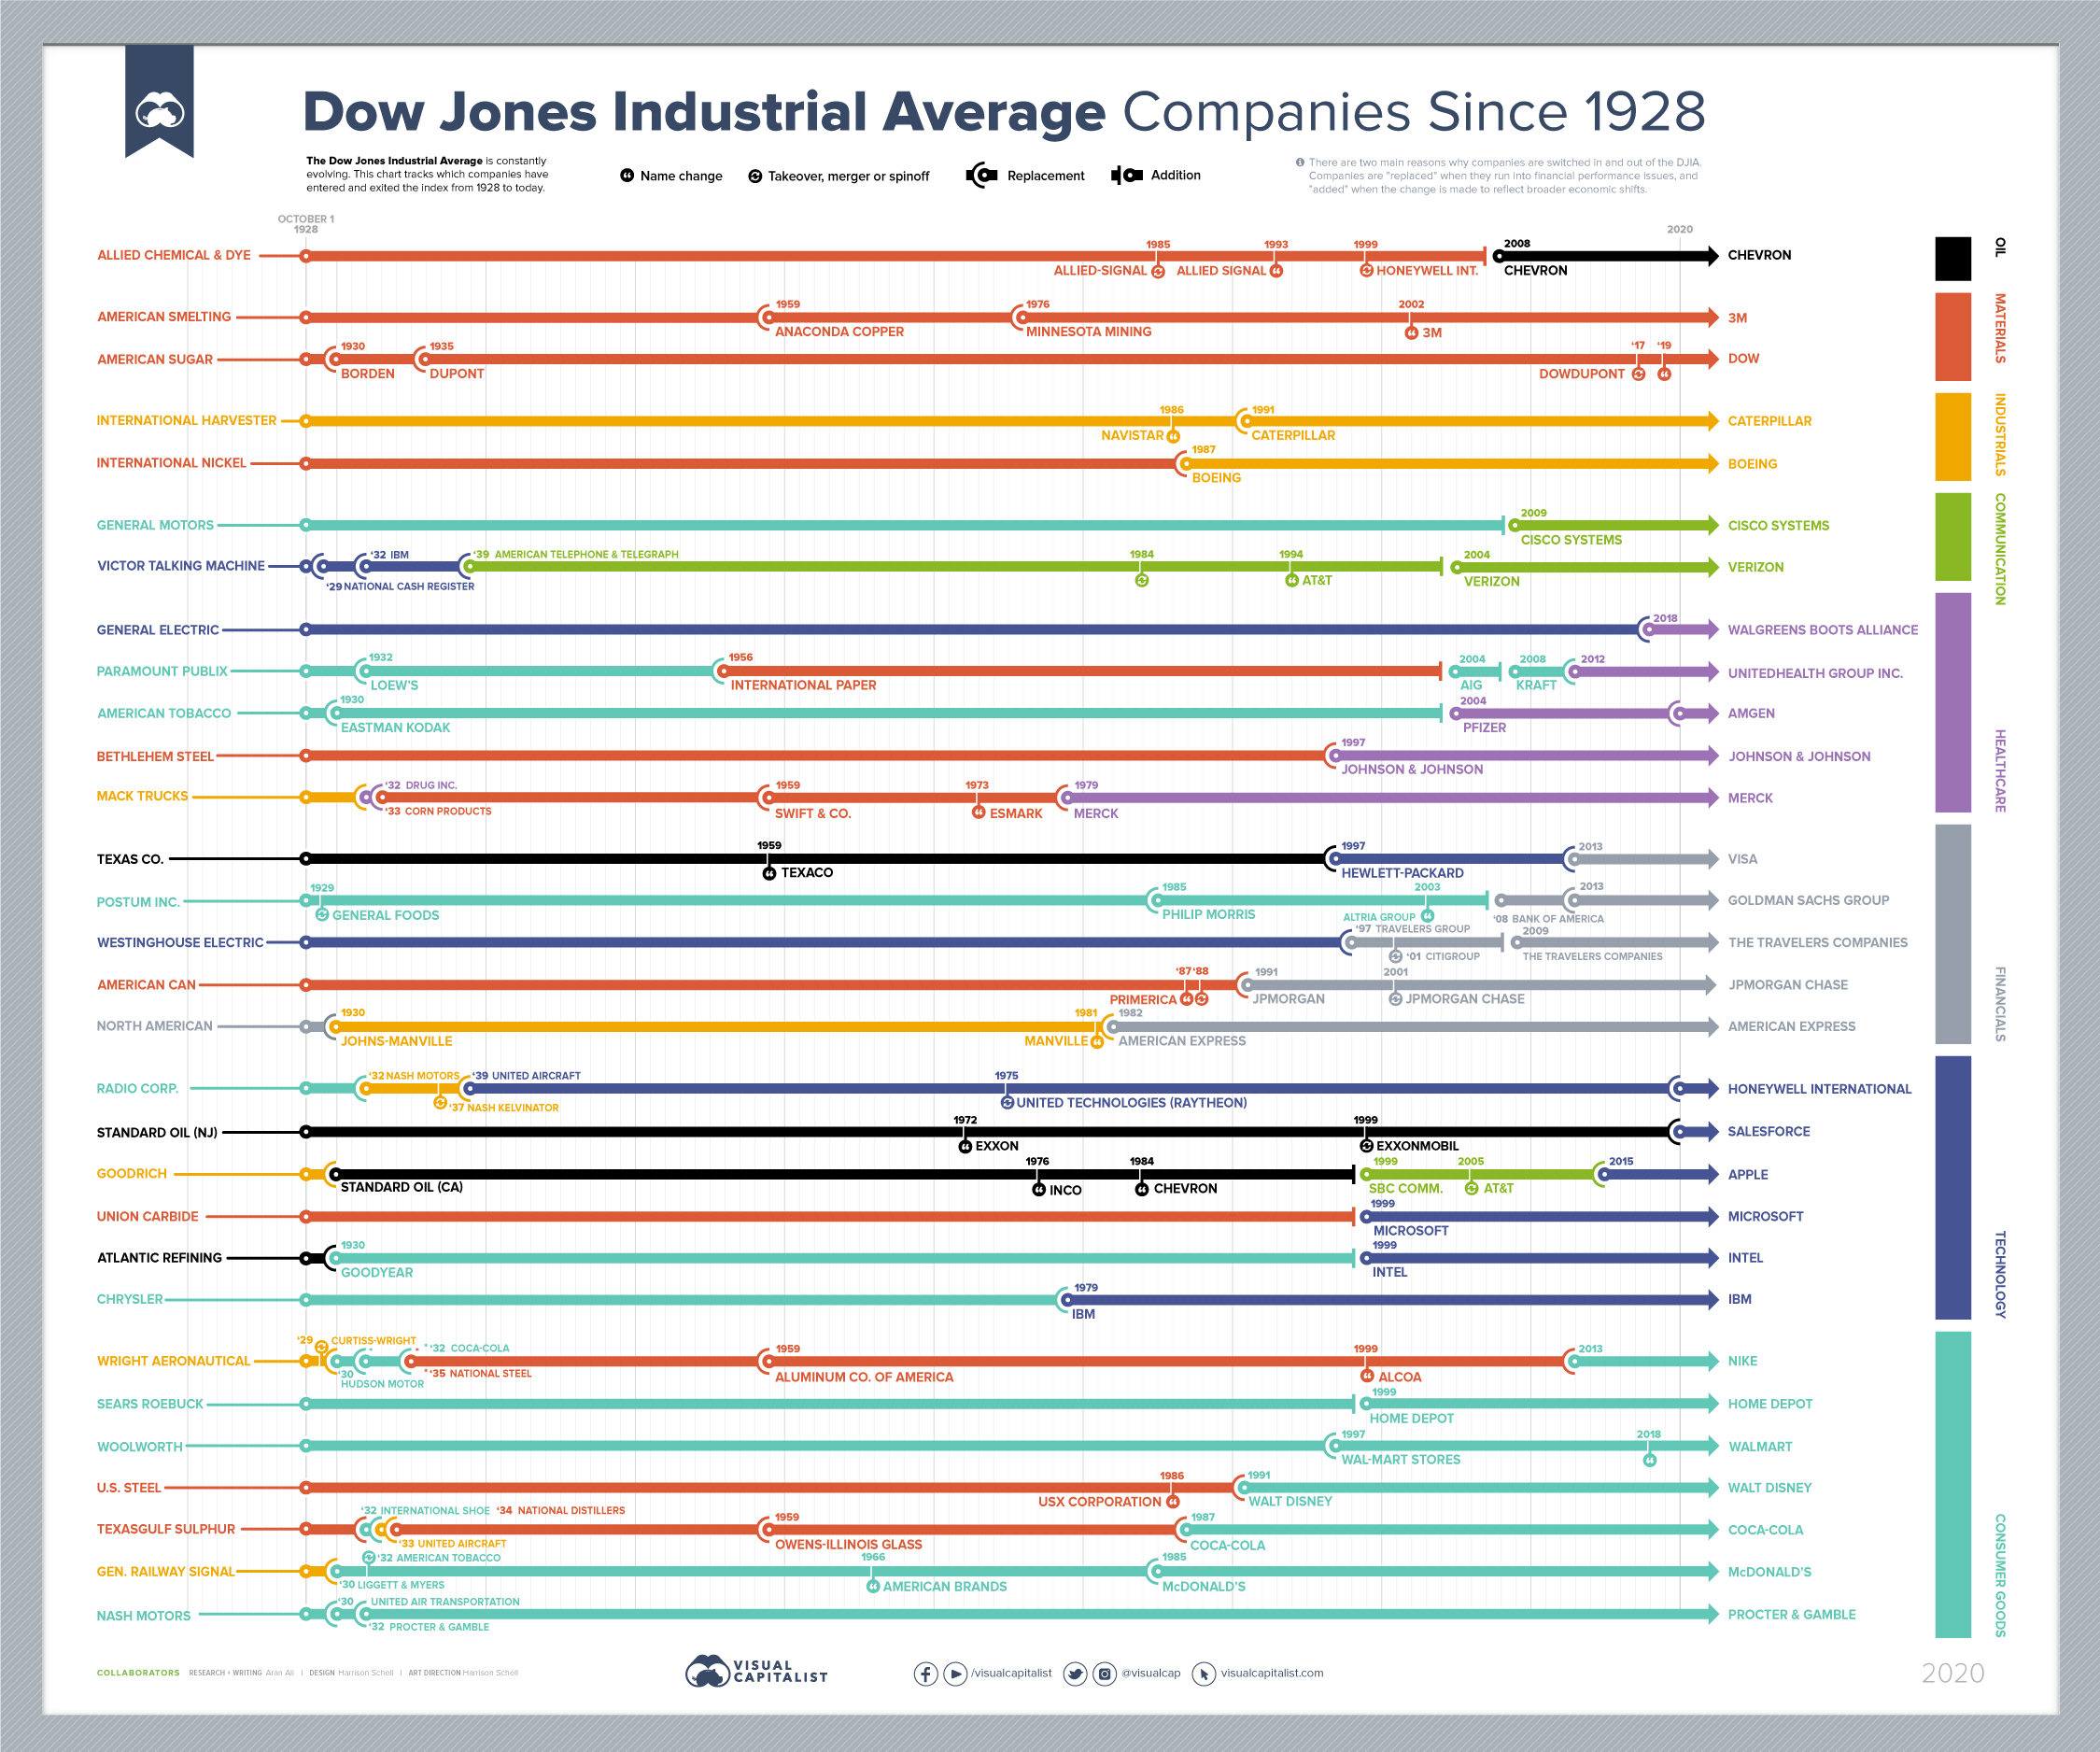


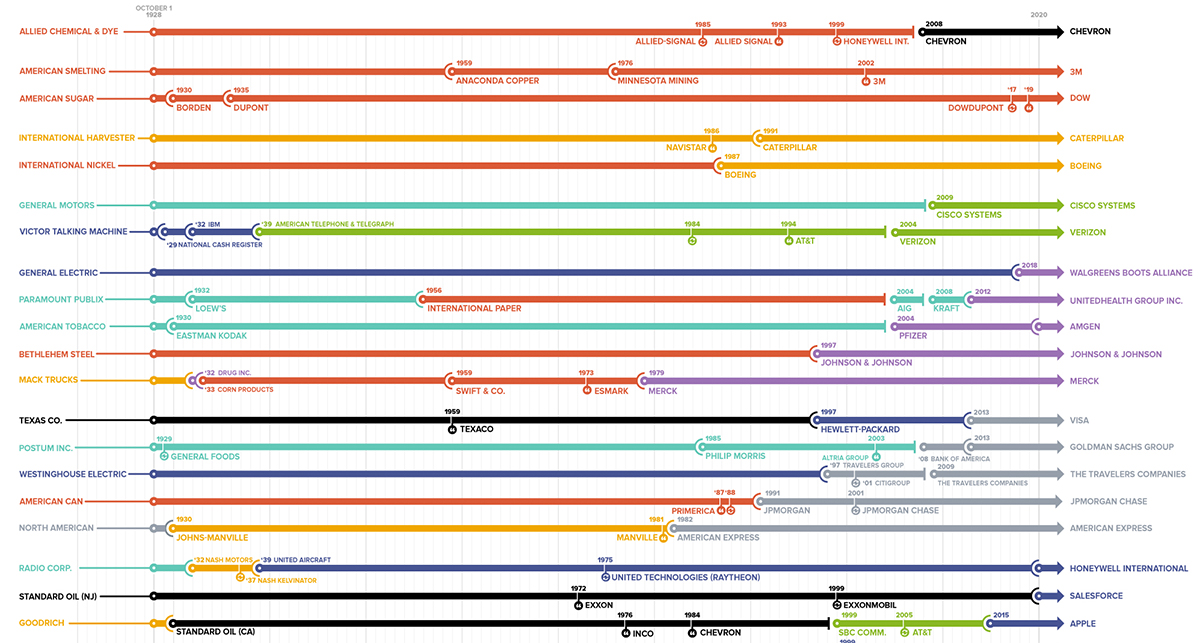
Every Company In and Out Of The Dow Since 1928
View the high resolution of this infographic by clicking here.
The Dow Jones Industrial Average (DJIA) is reported on daily by every major finance and media platform—a testament to its importance and relevance in global financial markets.
The market benchmark has a rich history embedded alongside America’s rise as a global superpower in the 20th century, and the inflows and outflows of companies on the 30 stock index coincide with broader secular trends. For example, the delisting of many industrial stocks over time encapsulates America’s transition towards a service-based economy. Meanwhile, the addition of tech companies in the last few decades paints a similar picture of change.
Today’s infographic looks at Dow data spanning over nine decades, all the way back to the tail end of the Roaring Twenties.
Crank Up The Volatility
An increasingly competitive and accelerating business landscape results in greater churn for stock market indices.
In fact, in the 92 years of activity visualized for the DJIA, there were 93 changes in its composition. This is not surprising, as the average duration of a company’s tenure on American indices has been trending down for decades—that said, 63% of Dow changes occurred in the second half of the 92 year sample period.
The current iteration of the DJIA includes some long-serving constituents, with the average length of companies in the index sitting at 20 years. General Electric was the last standing member of the original group from 1928, but in 2018, they were replaced by Walgreens.
2020 has also brought with it some fresh faces, including three changes so far. They include Salesforce for ExxonMobil, Amgen for Pfizer, and Honeywell International for United Technologies. Here’s a full list of the current companies in the index:
| Company | Market Cap (B) | TTM Revenue (B) | YTD Stock Performance |
|---|---|---|---|
| American Express | $81.1 | $34.3 | -21.0% |
| Amgen | $149.8 | $23.1 | 3.0% |
| Apple | $1996 | $273.9 | 55.0% |
| Boeing | $94.6 | $66.6 | -49.5% |
| Caterpillar | $81.2 | $43.6 | -0.2% |
| Cisco Systems | $167.2 | $49.3 | -18.5% |
| Chevron | $134.8 | $115.0 | -40.3% |
| Goldman Sachs Group | $69.3 | $18.2 | -14.4% |
| Home Depot | $299.2 | $119.3 | 24.6% |
| Honeywell International | $116.6 | $34.5 | -7.1% |
| IBM | $109.1 | $74.3 | -9.8% |
| Intel | $221.5 | $79.0 | -14.5% |
| Johnson & Johnson | $392.2 | $80.5 | 0.8% |
| Coca-Cola | $212.2 | $34.3 | -11.6% |
| JPMorgan Chase | $295.4 | $76.3 | -31.6% |
| McDonald's | $170.9 | $19.1 | 10.7% |
| 3M | $93 | $31.4 | -9.4% |
| Merck & Co. | $209.9 | $47.2 | -10.0% |
| Microsoft | $1596.3 | $143.0 | 31.4% |
| Nike | $196.4 | $37.3 | 24.7% |
| P&G | $347.3 | $71.0 | 9.9% |
| The Travelers Companies | $27.6 | $28.6 | -21.6% |
| United Health Group Inc. | $297.4 | $195.1 | 3.5% |
| Salesforce | $195.8 | $19.4 | 52.2% |
| Verizon | $255.3 | $129.7 | -3.5% |
| Visa | $428.8 | $22.9 | 6.1% |
| Walgreens Boots Alliance | $31.3 | $138.7 | -40.0% |
| Walmart | $398.9 | $542.0 | 15.4% |
| Walt Disney | $225.6 | $69.8 | -13.3% |
| Dow | $35.4 | $3.1 | -14.9% |
| Average | $297.67 | $88.5 | -3.1% |
Although all the stocks in the DJIA are intended to be in line with broader economic trends, the similarities end there. For some DJIA stocks, 2020 has brought growth and opportunity—for others, quite the opposite.
YTD stock price performances range vastly from a high of 55% to a low of -49%. Perhaps it serves as no surprise that the best performing companies serve in the tech space like Apple, Microsoft, and Salesforce, while the worst performing are the likes of Boeing and Chevron.
A Sign of the Times
The three changes in 2020 can best be described as modernizing the Dow.
The delistings include businesses in industries such as Aerospace & Defense and Big Pharma. But the most monumental exit? ExxonMobil, which was once the biggest company by market capitalization in America.
Their fall from grace best symbolizes the state and direction the world is headed towards.


Green
How Carbon Credits Can Help Close the Climate Funding Gap
To keep a 1.5℃ world within reach, global emissions need to fall by as much as 45% by 2030, and carbon credits could help close the gap.


How Carbon Credits Can Help Close the Climate Funding Gap
Governments around the world have committed to the goals of the Paris Agreement, but their climate pledges are insufficient. To keep a 1.5℃ world within reach, global emissions need to fall by as much as 45% by 2030.
Bold and immediate action is essential, but so are resources that will make it happen.
In this graphic, we have partnered with Carbon Streaming to look at the role that the voluntary carbon market and carbon credits can play in closing that gap.
More Funds are Needed for Climate Finance
According to data from the Climate Policy Initiative, climate finance, which includes funds for both adaptation and mitigation, needs to increase at least five-fold, from $1.3T in 2021/2022, to an average $8.6T annually until 2030, and then to just over $10T in the two decades leading up to 2050.
That adds up to a very large number, but consider that in 2022, $7.0T went to fossil fuel subsidies, which almost covers the annual estimated outlay. And the world has shown that when pressed, governments can come up with the money, if the global pandemic is any indication.
Mobilizing Carbon Finance to the Developing World
But the same cannot be said of the developing world, where debt, inequality, and poverty reduce the ability of governments to act. And this is where carbon credits can play an important role. According to analyses from Ecosystem Marketplace, carbon credits help move capital from developed countries, to where funds are needed in the developing world.
For example, in 2019, 69.2% of the carbon credits by volume in the voluntary carbon market were purchased by buyers in Europe, and nearly a third from North America. Compare that to over 90% of the volume of carbon credits sold in the voluntary carbon market in 2022 came from projects that were located outside of those two regions.
Carbon Credits Can Complement Decarbonization Efforts
Carbon credits can also complement decarbonization efforts in the corporate world, where more and more companies have been signing up to reduce emissions. According to the 2022 monitoring report from the Science Based Targets initiative, 4,230 companies around the world had approved targets and commitments, which represented an 88% increase from the prior year. However, as of year end 2022, combined scope 1 and 2 emissions covered by science-based targets totaled approximately 2 GtCO2e, which represents just a fraction of global emissions.
The fine print is that this is just scope 1 and 2 emissions, and doesn’t include scope 3 emissions, which can account for more than 70% of a company’s total emissions. And as these emissions come under greater and greater scrutiny the closer we get to 2030 and beyond, the voluntary carbon credit market could expand exponentially to help meet the need to compensate for these emissions.
Potential Carbon Credit Market Size in 2030
OK, but how big? In 2022, the voluntary carbon credit market was around $2B, but some analysts predict that it could grow to between $5–250 billion by 2030.
| Firm | Low Estimate | High Estimate |
|---|---|---|
| Bain & Company | $15B | $30B |
| Barclays | N/A | $250B |
| Citigroup | $5B | $50B |
| McKinsey & Company | $5B | $50B |
| Morgan Stanley | N/A | $100B |
| Shell / Boston Consulting Group | $10B | $40B |
Morgan Stanley and Barclays were the most bullish on the size of the voluntary carbon credit market in 2030, but the latter firm was even more optimistic about 2050, and predicted that the voluntary carbon credit market could grow to a colossal $1.5 trillion.
Carbon Streaming is Focused on Carbon Credit Integrity
Ultimately, carbon credits could have an important role to play in marshaling the resources needed to keep the world on track to net zero by 2050, and avoiding the worst consequences of a warming world.
Carbon Streaming uses streaming transactions, a proven and flexible funding model, to scale high-integrity carbon credit projects to advance global climate action and UN Sustainable Development Goals.
Learn more at www.carbonstreaming.com.

-

 Green1 week ago
Ranking the Top 15 Countries by Carbon Tax Revenue
This graphic highlights France and Canada as the global leaders when it comes to generating carbon tax revenue.
-

 Green1 week ago
Ranked: The Countries With the Most Air Pollution in 2023
South Asian nations are the global hotspot for pollution. In this graphic, we rank the world’s most polluted countries according to IQAir.
-

 Environment2 weeks ago
Top Countries By Forest Growth Since 2001
One country is taking reforestation very seriously, registering more than 400,000 square km of forest growth in two decades.
-

 Green3 weeks ago
Ranked: Top Countries by Total Forest Loss Since 2001
The country with the most forest loss since 2001 lost as much forest cover as the next four countries combined.
-

 Markets2 months ago
The World’s Top Cocoa Producing Countries
Here are the largest cocoa producing countries globally—from Côte d’Ivoire to Brazil—as cocoa prices hit record highs.
-

 Environment2 months ago
Charted: Share of World Forests by Country
We visualize which countries have the biggest share of world forests by area—and while country size plays a factor, so too, does the environment.

-

 Mining1 week ago
Gold vs. S&P 500: Which Has Grown More Over Five Years?
-

 Markets2 weeks ago
Ranked: The Most Valuable Housing Markets in America
-

 Money2 weeks ago
Which States Have the Highest Minimum Wage in America?
-

 AI2 weeks ago
Ranked: Semiconductor Companies by Industry Revenue Share
-

 Markets2 weeks ago
Ranked: The World’s Top Flight Routes, by Revenue
-

 Countries2 weeks ago
Population Projections: The World’s 6 Largest Countries in 2075
-

 Markets2 weeks ago
The Top 10 States by Real GDP Growth in 2023
-

 Demographics2 weeks ago
The Smallest Gender Wage Gaps in OECD Countries